As an investor I am late to the party as far as following technical indicators. Only in the last few years have I been really looking at momentum when it comes to stock prices. In particular, it is clear to me that the US stock market as measured by the Standard and Poors 500 (S&P 500) can show predictive negative and positive patterns.
Recently, the S&P 500 dropped below its 200 day moving average. To see what historical implications this has, take a look at this article. A great statistic quoted in the article:
Since 1960, 22 of the 25 worst days have occurred below the 200-day moving average. Of the 100 worst single days over the last 55 years, 83 of them happened while stocks were below the 200-day.
(Source: The Irrelevant Investor)
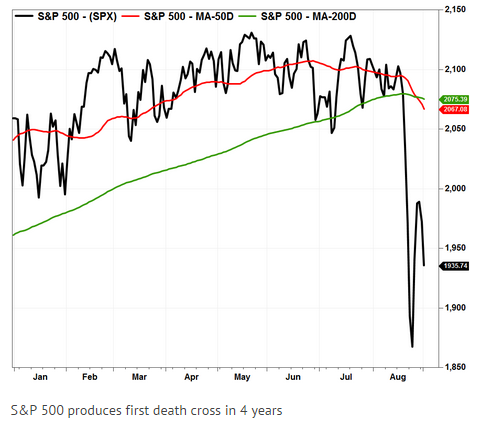
Recently, a death cross also appeared across all averages, which technical traders also consider a negative indicator.
Its easy to look for technical reasons to be bearish when the market is having the recent wild swings – so I have to be careful to not let the drops cause a sell low buy high mentality. But in tracing these technical indicators an moving averages on Puget Investor, if you look at the historical performance of weighting and un-weighting the S&P 500 you can see a profitable pattern develop.
So as an investor you have to decide, should I sell now that the market is 10% off its highs, and sell at the bottom of the correction, or is this the start of a long term decline and get out while you can? Nobody knows – but I am leaning at least in the short run to lighten up on my stock allocation, given the prevalence of these negative technical indicators.