I have always been diligent about looking at past performance of mutual funds prior to investing, and consider it to be one factor when comparing mutual funds. However a recent improvement I made to the VFS Daily Investment contest caused me to look at historical performance in a different light.
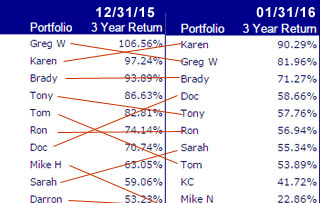
Starting in 2016, I am providing a prize for the portfolio with the best 3 year cumulative return. The purpose was to reward ‘long-term’ excellence, and assumed the top portfolios would be pretty consistent. However, I was surprised when I saw the results for 01/31/16 – the rankings for the top 10 portfolios changed dramatically:
So this caused me to immediately assume my calculations were messed up – so I did a little analysis of the top two portfolios:
| Karen’s Portfolio | Greg’s Portfolio | ||||||
| Month | Monthly Return | $100 invested 1/1/13 to 12/31/15 |
$100 invested /1/13 to 1/31/16 |
Monthly Return | $100 invested 1/1/13 to 12/31/15 |
$100 invested 2/1/13 to 1/31/16 |
|
| 1/31/2016 | -3.89% | $ 190.29 | -7.54% | $ 181.96 | |||
| 12/31/2015 | 2.34% | $ 197.24 | $ 197.99 | -4.98% | $ 206.56 | $ 196.79 | |
| 11/30/2015 | 2.61% | $ 192.73 | $ 193.46 | 5.99% | $ 217.37 | $ 207.09 | |
| 10/31/2015 | 19.97% | $ 187.82 | $ 188.54 | 9.37% | $ 205.08 | $ 195.38 | |
| 9/30/2015 | -2.58% | $ 156.55 | $ 157.15 | -4.11% | $ 187.51 | $ 178.64 | |
| 8/31/2015 | -2.06% | $ 160.70 | $ 161.31 | 5.02% | $ 195.56 | $ 186.31 | |
| 7/31/2015 | 8.10% | $ 164.07 | $ 164.70 | 0.67% | $ 186.21 | $ 177.40 | |
| 6/30/2015 | -4.63% | $ 151.78 | $ 152.36 | -1.96% | $ 184.98 | $ 176.23 | |
| 5/31/2015 | 1.59% | $ 159.16 | $ 159.76 | 4.19% | $ 188.68 | $ 179.76 | |
| 4/30/2015 | 1.75% | $ 156.67 | $ 157.26 | 5.40% | $ 181.09 | $ 172.53 | |
| 3/31/2015 | -2.02% | $ 153.98 | $ 154.56 | -0.89% | $ 171.82 | $ 163.70 | |
| 2/28/2015 | 7.40% | $ 157.15 | $ 157.75 | 5.35% | $ 173.36 | $ 165.16 | |
| 1/31/2015 | -1.26% | $ 146.32 | $ 146.88 | 7.62% | $ 164.55 | $ 156.77 | |
| 12/31/2014 | -3.65% | $ 148.19 | $ 148.75 | -2.65% | $ 152.90 | $ 145.68 | |
| 11/30/2014 | 2.77% | $ 153.80 | $ 154.39 | 2.32% | $ 157.06 | $ 149.64 | |
| 10/31/2014 | 5.12% | $ 149.65 | $ 150.22 | 0.23% | $ 153.50 | $ 146.24 | |
| 9/30/2014 | -2.45% | $ 142.36 | $ 142.90 | -1.79% | $ 153.15 | $ 145.91 | |
| 8/31/2014 | 1.93% | $ 145.94 | $ 146.49 | 4.60% | $ 155.94 | $ 148.57 | |
| 7/31/2014 | 1.37% | $ 143.17 | $ 143.71 | -1.79% | $ 149.08 | $ 142.03 | |
| 6/30/2014 | 0.65% | $ 141.24 | $ 141.77 | 3.03% | $ 151.80 | $ 144.62 | |
| 5/31/2014 | 5.11% | $ 140.32 | $ 140.85 | 6.09% | $ 147.34 | $ 140.37 | |
| 4/30/2014 | -0.33% | $ 133.50 | $ 134.01 | -0.15% | $ 138.87 | $ 132.31 | |
| 3/31/2014 | -0.98% | $ 133.95 | $ 134.46 | -3.44% | $ 139.09 | $ 132.51 | |
| 2/28/2014 | 6.70% | $ 135.27 | $ 135.78 | 4.00% | $ 144.04 | $ 137.23 | |
| 1/31/2014 | -2.99% | $ 126.78 | $ 127.26 | -1.80% | $ 138.50 | $ 131.95 | |
| 12/31/2013 | 2.63% | $ 130.69 | $ 131.18 | 4.74% | $ 141.04 | $ 134.37 | |
| 11/30/2013 | 2.86% | $ 127.34 | $ 127.82 | 3.31% | $ 134.65 | $ 128.29 | |
| 10/31/2013 | 9.14% | $ 123.80 | $ 124.27 | 7.58% | $ 130.34 | $ 124.18 | |
| 9/30/2013 | 0.90% | $ 113.43 | $ 113.86 | 5.08% | $ 121.16 | $ 115.44 | |
| 8/31/2013 | -1.22% | $ 112.42 | $ 112.84 | -1.51% | $ 115.31 | $ 109.86 | |
| 7/31/2013 | 4.78% | $ 113.81 | $ 114.24 | 9.06% | $ 117.07 | $ 111.54 | |
| 6/30/2013 | -1.71% | $ 108.61 | $ 109.02 | 0.24% | $ 107.35 | $ 102.27 | |
| 5/31/2013 | 1.48% | $ 110.50 | $ 110.92 | 1.08% | $ 107.09 | $ 102.02 | |
| 4/30/2013 | 3.26% | $ 108.89 | $ 109.30 | 1.44% | $ 105.94 | $ 100.93 | |
| 3/31/2013 | 2.90% | $ 105.45 | $ 105.85 | 2.15% | $ 104.44 | $ 99.50 | |
| 2/28/2013 | 2.87% | $ 102.48 | $ 102.87 | -2.60% | $ 102.23 | $ 97.40 | |
| 1/31/2013 | -0.38% | $ 99.62 | 4.96% | $ 104.96 | |||
And I found my explanation. Using the approach of measuring return in terms of ‘$100 invested 3 years ago now is worth x’ does really magnify recent performance. Note that even though Gregs portfolio was down 7.5% in January, it knocked $15 off his hypothetical investment. So losses for the leaders are magnified as they hypothetically have more assets to lose.
The other important point is the starting point makes a big difference. Greg’s portfolio for the period 2/1/13 – 01/31/16 got hurt, because he had a decent month in January (highlighted in green), which no longer counted. Removing the 4% gain from the first month knocked $10 off the 3 year return, further causing the large drop in Greg’s portfolio’s value.
So the moral to the story? Be careful when looking at mutual fund past performance – as the time period you are looking at may make a big difference in how the performance is measured. Or better yet – maybe mutual fund expense ratio is a much better indicator of future fund performance, since past performance is a pretty fluid measurement.