I have once again been busy in the Stock Market model laboratory, looking to optimize things and get a better handle on market trends. Over the past couple years my model has been one dimensional, basing predictions on a momentum / buy the dips strategy incorporating yield curve information. This model has worked out OK for Asset classes and individual stocks, but not meaningful for stock market sectors.
So the big improvement I just incorporated was to integrate multiple datasets into my model. What this means is I now look at historical technical data across multiple datasets, triangulating historical trends to come up with a prediction.
Lets walk through an example. Rocky Brands (RCKY) is a stock I have and it has some great correlations across 3 datasets:
- RCKY’s movement appears to coorelate inversely with the 10 month moving average price of oil. If RCKY moves up slower than the price of oil, its odds of outperforming the following month are increased:
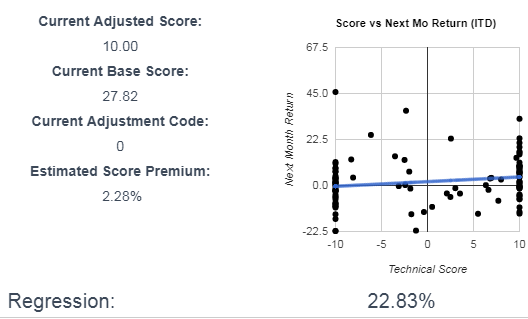 I am OK with this seemingly odd correlation, because it is a maker or work boots used by oil field workers. This influence is often called out in the earnings call, so its likely a valid coorelation.
 - RCKY’s movement correlates with the inverse movement of the Vanguard Consumer Discretionary Sector index, on a 4 month rolling average basis:
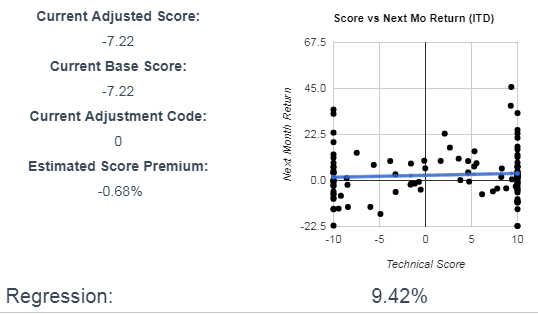 A slight coorelation, but if on a 4 month rolling average basis RCKY performs worse than the index, the next month shows a slight outperformance.
 - RCKY’s movement coorelates with the inverse movement of the US Microcap Stock Index on a 4 month rolling average basis:
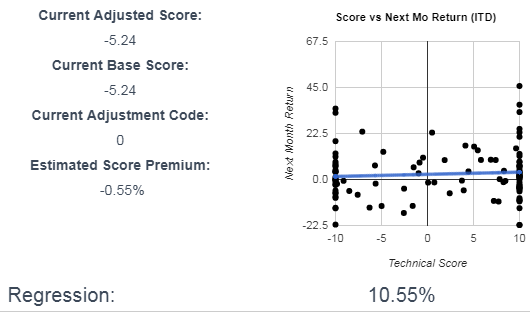 Again, a slight coorelation, but RCKY is a Microcap stock, so it does tend to catch up if underperforming for a 4 month period.
Are these meaningful regressions? Thats a valid question. But if you add all these together, here is a summary regression for RCKY:
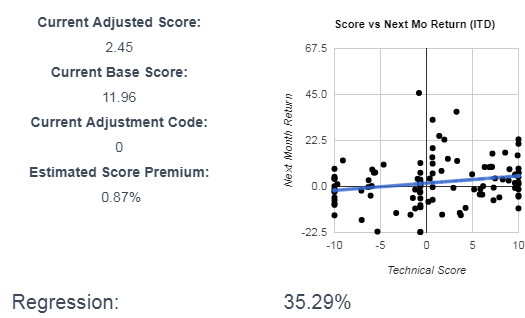
I think a 35% overall regression is meaningful. At least it should be better than guessing. Note that even though two of the three regressions show a current negative score, the overall score is still positive (2.45), because the index with the strongest coorelation was positive.
There are still some flaws to this model, and also still finding minor bugs on a weekly basis. But I am constantly making improvements to this model, and have a long roadmap of scheduled enhancements. I will continue to post updates on ideas I have and changes I implement. Any thoughts on my approach or questions are welcome.