Time for my 5th annual solar power progress report. This is the fifth year of my solar production experiment (for the full story click here), and so far things are still OK. For 2019, the panels produced 3525 kilowatts of power, down almost 2% from the previous year. Below is a chart of my 4 years of production by month:
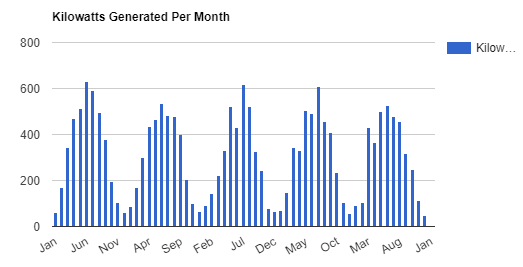
I do believe I am starting to see degradation in the panel performance, as each year production seems to average down. However, as shown in the chart – our summer in the Pacific Northwest was much cloudier than normal, hitting my peak production months pretty hard. I forecast an increase in production in 2020, as the weather was abnormally bad during those summer months.
Payback Update
As I have mentioned in previous posts, I had originally penciled out a 6 year payback when I made the decision to move forward with this plan. Last year after detailed analysis I knocked it back to 10-13 years payback. This year I have dug a little deeper and have a much better payback analysis.
My current payback analysis shows I should get my original investment amount back sometime in 2028, which works out to a 13 year payback. This analysis assumes two major factors:
- Drop in Incentives. My installation incentives do appear to expire on 6/20/20. This will be a huge hit to my return, although I had factored this in to the original estimate. If I had one more year of incentives, that would have moved my payback to around 8 years, so it is a significant hit. I believe there are incentives for new installations in 2020, but if you are considering installing panels, make some rough calculations and make sure you do a payback analysis.
- Electricity rates stabilizing. My current payback analysis assumes that electricity rates will stabilize, rather than continue dropping. This drop in rates over the last 5 years is probably most responsible for me not meeting my original payback estimate. I have given up with any assumption that electricity rates will increase, all I can do now (from a producer point of view) is hope for rates increasing).
This year I did a projected rate of return for the first time. Assuming my panels keep producing roughly the same amount of power through 2030, my rate of return on this investment will be around 1.03% a year. While that is low, its not a disaster. Also, at the end of the the payback period I will still have functioning panels and the meter infrastructure from the original investment. So if was to upgrade my panels in 2030, and start the investment process all over again, the installation would be much cheaper and I would get a significantly better payback.
Solar panel prices dropped a bit more in 2019, down to $0.77 a kilowatt, and I look for continued drops throughout the 2020’s.
Power Use Report
Last year I started recording my power use, as I often get asked what percentage of my use do I generate. In 2019, my power use was down 4.2% from the previous year. I attribute this to two factors – less air conditioning during the summer, and a full year of a new energy saving refrigerator. In 2019, my solar installation generated 47.64% of the overall electricity I used.
I still think residential solar / utility scale wind and solar is the power model of the future. However, given the current incentive structure I am not sure its economically feasible in many locations in the northwest. So if you are considering an installation, it will be important for you to estimate your annual production correctly. If you have any questions regarding a payback analysis, feel free to leave a question in the comments and I can get back to you.