I have been building prediction modeling applications for years as a investor, as a way to try to identify when the various asset classes or particular stocks may be over or under priced. My current model is over 15 years old, and as you might guess is becoming a huge mess of code-spaghetti which is becoming difficult to modify.
Recently, I stumbled across a full suite of college football data, and started to wonder if one could build a model to predict college football games. Rather than try to copy my existing investment model, I decided to mentally start from scratch and figure out the best way to design predictive models for maintainability. I now have a college football game prediction model up and running, using my new pattern I designed during this process:
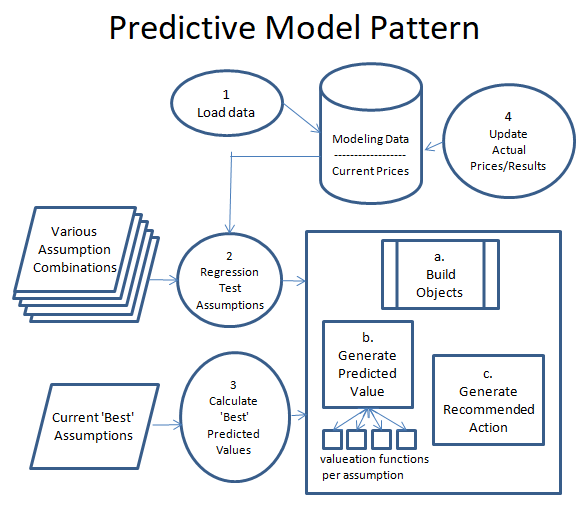
Now this might be Data Science 101 to a data scientist, but this is not my area of expertise. My software suite is a SQL Server database and C#, tools I am very comfortable with. Rather than learn new tools and software specially built for data modeling, I thought it would be more interesting to design my own custom approach. I am a software developer, so my thinking how how to build this process was inspired my Model/View/Controller (MVC), a software design pattern that focuses on separation of logic for interconnected systems. So taking this foundation, I have broken the process of setting up an managing the model into 4 main components.
- Create Program to Load Data. Before I build a model, I have to make sure I have access to the data necessary to power it. There are plenty of great API’s to gather investment data, and if necessary data can be gathered via data scraping. I have a good library of tools to call APIs, and a nice suite of data scraping tools. So building the logic usually takes some time, but the logic to gather the data can be nicely compartmentalized for easy maintenance.
- Create Program to Regression Test Various Assumptions. Before building the program, you have to define a rough set of assumptions as to the cause and effects of various factors. The set of assumptions you create can only be limited by the data you have available. For example, for my College Football prediction model one assumption I tested was that a team is more valuable after a big home game loss. The assumption is the team might be more motivated to do well following a bad home loss, and potential betters are soured on the team. So you look at the data you have, then create various assumptions you can test against the data. Once you have a set of assumptions, you create a program to fire the assumptions at your prediction engine with varying the weight of each assumption each run. Doing this you hopefully identify assumptions that have no correlation to future performance, and ones that have a strong correlation or inverse correlation to future performance. Below I have expanded on how the prediction engine is built, as it is a core piece of the program.
- Create Program to calculate the ‘best’ predictions. Once you have tested various factors against your historical data, choose the factors and weightings of each factor that performed best of all the factor combinations you fired at at the prediction engine. This will be what generates the predictions, then looks at the current price (or the current betting line in the case of my college football model), and determine the ‘best’ value prediction. Note that I plan to rerun my regression tests on this model quarterly, so that I can see how well the assumption weightings are holding up. If some start to deteriorate, I may adjust factors and weightings as appropriate.
- Create Program to track predictions and update results. I think this is perhaps the most important piece. The prediction engine bases it’s prediction based on past data, so it is important to see if past data accurately predicts future results. So for example for the college football predictions, every Monday I run a job that updates the weekend scores, then compares the results to my predictions for the week. Each week I will look closer at the losses, to see what I missed, and maybe give me some ideas for additional factors to add. Of course, new factors may mean collecting more data, which further adds to the effort of building and maintaining the model. It is a very iterative process, as optimizations can always be made.
The Prediction Engine
Building the prediction engine is an iterative process in itself. The plan is to start small, then slowly add additional calculations over time. As long as additions are managed in an organized manner, the code base should be maintainable even after adding a large number of factors. The prediction engine (described in the big square in the diagram above) consists of 3 major parts.
a. Build Objects. The first thing to do when firing up the prediction engine is to pull the data stored in the database into a view model that exposes the data in a way to be easily accessible. These are typically complex objects that represent the entity you are making a prediction on (i.e. football game, a stock market security, asset class, etc.). For instance, a college football model would pull in a game object, which would have two teams attached to it with all the statistics and history needed for each team. For instance, a ‘bad previous week home team loss factor’ will require looking at past game performance in order to see if the a team had a bad loss in the previous week. As long as the data is there, that is a fairly simple subroutine to write.
b. Generate Predicted Value. Now that you have your data accessible – fire your list of assumption factors and weightings to calculate a value. To simplify the architecture of this, I have a separate subroutine for each factor calculation to try to avoid my logic bloat. This will allow me to isolate factors, and add new ones or delete invalid ones as necessary.
c. Generate Recommended action. Once you have calculated the value of all your assumptions against an object, you should have a score for that object. That score can then be compared to the price of the object to see if there is any action to be taken. For example, take a college football game, and given your assumptions and the data available step b came up with a calculation that the home team should win by 3 points. If the betting line has the home team favored by 14, and your threshold for action is a 7 point differential, then the recommendation action would be to place a bet on the visiting team. The same works for a stock market security. If step b calculates a stock price of $15, and the stock is priced at $10 the recommended action might be to buy the stock.
Note that it is also valuable to track the variability of the model in the form of standard deviation or R value. Some models may show a coorelation, but have a wide deviation. These deviations will help you set your ‘time to take action’ price. Typically the wider the deviation, the higher I set my action price.
Breaking the logic for this prediction engine into segmented parts should really help the management of the logic. In addition, I have a pretty good library of reusable logic components that I should be able to apply across multiple predictive models. My goal here is to slowly increase the size and scope of the calculations, while keeping the overall system pretty simple.
Now that I have my college football predictive model working, I will just continue to add assumptions to see if I can continue to increase the accuracy of my predictions. Then I will start tearing out components of my existing investment prediction engine, and rebuild it using this new model.
When will I be done with this project? Hopefully never. If all goes well, these models should be continually evolving and growing as more data is collected, and hopefully become more accurate.