Check out my latest article at Seeking Alpha:
3 Reasons Coinstar May Surprise On The Upside
If you are a member of Seeking Alpha- please add me to your list of people you follow!
Check out my latest article at Seeking Alpha:
3 Reasons Coinstar May Surprise On The Upside
If you are a member of Seeking Alpha- please add me to your list of people you follow!
Esterline Technologies (ESL) has always been an interesting company to me – a collection of 10 plus semi-autonomous companies focused on aerospace and defense. Since their first quarter earnings report was released on February 28th, the stock has outperformed the S&P 500 (up 5.5% VS 2.5% for the S&P 500), which caused me to dig a little deeper into the earnings report to see if I could find a reason.
First, here is an overview of some key metrics for Esterline over the last few years:

Annual revenue growth is still positive, at a relatively healthy 8.9%. While the revenue growth is slowing faster than I would prefer, at this point I will chalk it up to macro factors rather than to management issues. However this will be a metric to watch closely in future earnings releases.
Trailing 12 month after tax margin has been relatively flat (barring the exception of the impairment charge Racal Acoustics Defense in third quarter 2012), so no big concerns there. However Inventories were up 5% from recent quarters – this is somewhat cautionary as it could indicate future write-downs impacting margins.
Perhaps the outperformance of the stock after the earnings release can be attributed to the new markets Esterline is exploring. With the slowing defense spending, Esterline has announced they have some opportunities in high-speed rail, nuclear power, and gaming initiatives. This must be the catalyst for growth that investors are anticipating, though it seems awfully early to be pricing these opportunities into the stock.
Note what this recent price increase has done to the stocks earnings yield. When I compare Esterline to another defense related company of approximately the same size, Flir Systems, Inc (FLIR), you notice the valuation for Esterline is not as attractive as it once was:
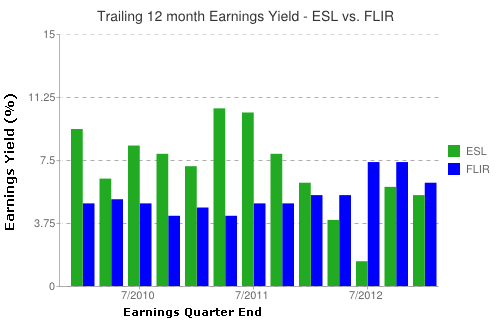
While Flir is not a pure comp to Esterline, this chart does indicate that much of the good news is priced into Esterline.
Conclusion
This quarters earnings report does have reasons for optimism, but I believe the stock may be over anticipating future catalysts for growth. Given the unanticipated US Government sequester (admittedly unanticipated by management), keep an eye on the annual revenue growth. Also keep an eye on the new market opportunities mentioned. Due to Esterline distributed organizational structure, they may be able to move quickly to gain traction. But I would need to see more proof first.
To see the full first quarter earnings report, click here.
I recently had an article published on SeekingAlpha.com with my read on Nordstrom’s Fourth Quarter Earnings. Check out the article at
http://seekingalpha.com/article/1225391-what-i-liked-about-nordstrom-s-q4-earnings
Amazon is a tough stock for a value investor like me to own – it has always been overvalued. Yet it has been a great stock for years – up over 10 times over 10 years. It currently is a $270 stock, with a negative 12 months earnings. Compare that to Google – $800 stock with $32 in annual earnings, or even a Costco – a $100 stock with $4 in trailing 12 month earnings.
I decided to run some comparisons of Amazon with Costco – somewhat similar retail presence, leaders in their field, and likely to thrive in the new internet-centric economy. First, take a look at this earnings yield comparison:
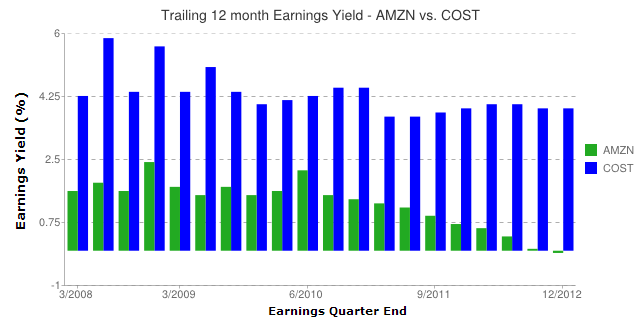
It doesnt alarm me that their earnings yield has gone negative – Amazon has always been running on tight margins, investing in growth. They are pumping lots of money into new distribution centers in many states to allow for quicker and cheaper shipping to more destinations. However the 18 month trend of shrinking yield – caused largely by the stock price runup, has me a little worried – and when compared to a solid company like Costco, they have a lot of ground to make up.
The other chart that bothers me a little more is the revenue growth chart:
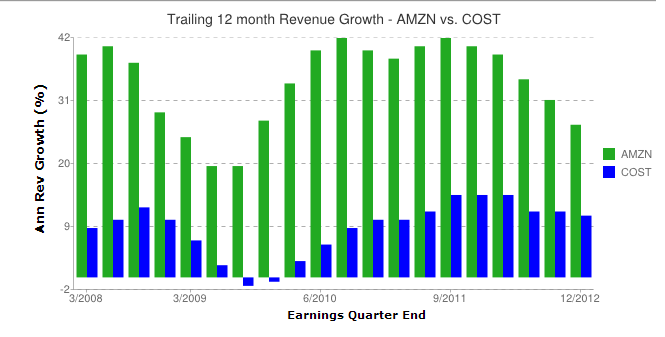
Revenue growth has been shrinking – perhaps the new distribution centers will help, but you have to wonder if the glory days of Amazon’s growth is behind it. The market certainly doesn’t think so – during this time Amazon has quadrupled:

As much as I like Amazon the company and its future prospects, at this point I think I can find better long term value in the stock market. Its tough to bet against this stock – its always proven doubters wrong, but maybe this time its time to get out.
So how would you feel about a stock that pays out a 10% dividend, has the income to cover its dividend, and is a leader in its industry? In a time of 2% 10 year T-Bills, you would guess this is too good to be true. Its not too good to be true – the stock is R.R. Donnelly & Sons (RRD). The one catch: even though its a leader in its industry – its industry is in the slowly melting printed advertising materials. I just started watching this this stock in the last few weeks. I have been wavering back and forth on it, trying to figure out if its a gold mine or a value trap. Here is a breakdown of the analysis I have done:
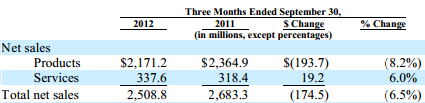
RRD has two lines of business – Products and Services. According to the companies last quarterly filing, the Company’s product offerings primarily consist of magazines, catalogs, retail inserts, books, directories, direct mail, financial print, forms, labels, statement printing, commercial print, office products and print management. The company’s service offerings primarily consist of logistics, premedia, EDGARrelated and XBRL financial services and certain business outsourcing services.
OK, so the service offerings sound kind of interesting – maybe the future of the company. But look – the shrinking products business is 7 times bigger than the growing services business:
Can the company survive long enough to build the service business? Will the print business shrink faster or slower in the future? The company has made a number of interesting acquisitions in the last two years, in both the product and services business:
On September 6, 2012, the Company acquired Express Postal Options International (“XPO”), a provider of international outbound mailing services to pharmaceutical, e-commerce, financial services, information technology, catalog, direct mail and other businesses.
On August 14, 2012, the Company acquired EDGAR Online, a leading provider of disclosure management services, financial data and enterprise risk analytics software and solutions.
On November 21, 2011, the Company acquired StratusGroup, Inc. (“Stratus”), a full service manufacturer of custom pressure sensitive label and paperboard packaging products for health and beauty, food, beverage and other segments.
On September 6, 2011, the Company acquired Genesis Packaging & Design Inc. (“Genesis”), a full service provider of custom packaging, including designing, printing, die cutting, finishing and assembling.
On August 16, 2011, the Company acquired LibreDigital, Inc. (“LibreDigital”), a leading provider of digital content distribution, ereading software, content conversion, data analytics and business intelligence services.
On August 15, 2011, the Company acquired Sequence Personal LLC (“Sequence”), a provider of proprietary software that enables readers to select relevant content to be digitally produced as specialized publications.
On June 21, 2011, the Company acquired Helium, Inc. (“Helium”), an online community offering publishers, catalogers and other customers stock and custom content, as well as a comprehensive range of editorial solutions, in which the Company previously held an equity
Are any of these acquisitions going to be a catalyst for future growth? Edgar Online is an interesting one to me, the others I am not familiar with.
The other big elephant in the room is debt. RR Donnelly has a lot of debt – giving it little wiggle room if things go bad. Check out these numbers from the latest quarterly report:
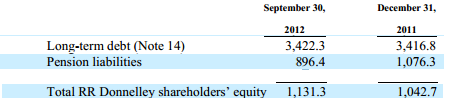
Thats a Debt Equity ration of 3 to 1, with a big pension liability to boot. Not for the faint of heart – thats about as high as they get.
The latest earnings for RR Donnelly come out on Feb. 26th. I am going to take a look at that before I make any decision on whether to include this in my portfolio. I will be looking closely at the revenue numbers, and if they look reasonably promising, I will likely initiate a small position. It seems reasonable that this stock has a place in a diversified portfolio, as long as you know things could get bad fast if there are any setbacks.
If you are still of the belief that Boards of Directors have the best interest of their shareholders in mind – I have bad news for you. Footnoted.org has a great example of Corporate malfeasance perpetrated by the CEO and the Board.
http://www.footnoted.com/buried-treasure/too-early-for-worst-footnote-of-2013/
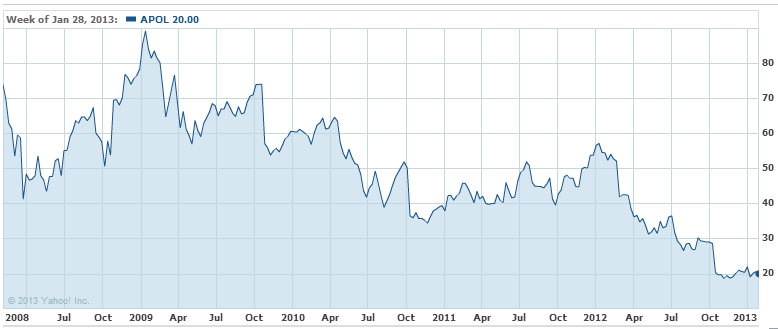
The board of directors has bestowed a gift to the outgoing Executive Chairman- I am sure it was meant as a nice gesture. In doing a little math, If you owned 100 shares of Apollo Group, worth about $2,000 as of this writing, that gift the board bestowed cost you approximately $5, and about $.75 a year to the uh…, less than needy recipient.
I am sure the board sensed the shareholders of the company would feel just as charitable, because any shareholder of the company over the last 5 years have given away more than that by just owning the stock. Seeing as the outgoing Executive Chairman holds over $200 million in Apollo stock, I guess everyone can understand why he deserves such a heartfelt gift.
The second annual investment contest wrapped up on December 31st with a record 16 participants. For the second straight year, more portfolios underperformed the S&P 500 than outperformed, showing how difficult it is to outperform the index.
| Portfolio | 2012 Return |
|---|---|
| Tony | 32.32 % |
| Tom | 26.74 % |
| Karen | 21.59 % |
| Greg W | 16.49 % |
| Doc | 15.68 % |
| Sarah | 15.54 % |
| Ron | 13.94 % |
| S&P 500 | 13.47 % |
| KC | 11.97 % |
| Lee | 8.59 % |
| Noreen | 6.92 % |
| Mike N | 6.66 % |
| Susie | 5.63 % |
| Mike H | 2.43 % |
| Brady | -2.51 % |
| Matt | -4.44 % |
| Lynn | -6.86 % |
Tony won this years contest, thanks largely to his huge January 2011 gain with USG (+26%), and MGM International (+25%). Tom also deserves special mention, finishing 2nd this year after a 3rd place finish last year. Tom’s picks are likely the best over the two year period of the contest.
I caught up with Tony via email to get more insight into his strategy that led him to such a huge gain for the year. “For the first few months I picked stocks from a variety of fields, banking, housing, hi-tech, gaming. I deleted them if they had a big run up and added them back in if they had fallen. Mid year I grew tired of working at it, so I just picked 4-5 stocks from the top of my head and kept them. Last couple months of the year I had a lead so I added some mutual funds to keep a more stable portfolio that would not be affected too much by one stock.”
Tony appears to be a top down investor, identifying market sectors that he believes will outperform the market, then identifying appropriate stocks in the chosen sectors. Interestingly, when evaluating stocks to buy, Tony also uses technical analysis to choose his stocks, looking at market performance instead of finanials to make trading decisions. “(I buy a stock when) technically is it at a low point. If I feel like paying attention the technical are more important than the fundamentals. But you have to be ready to dump it after a run up.” . So take heart those of you that don’t dig into company 10k’s and 8qs, not all successful investors follow historical financials closely. But you do have to pay attention.
Tony’s favorite stock right now is USG. “just because the housing market has been so beaten up so I think there is upside. But it has already had some bit run ups so I’m not sure how much more it has.”. Tony keeps the number of stocks he watches limited, “I pretty much stick with stocks I have been watching, a very small selection.”.
Tony’s market prediction for 2013? “Big ups and downs as we have a series of financial cliffs.”. Hmm.. sounds like a tricky market for fundamental and technical investors alike.
Thanks to all who participated in 2012, and good luck to all in 2013.
I was reviewing my stock market portfolio the other day, trying to make sure I understand why I have some of the stocks in my portfolio. Intuitive Surgical (ISRG) caught my eye – its a stock I bought a while ago (I actually don’t recall why now), and it had now grown into a top holding. I noticed my valuation model at Puget Investor had recently flagged it as underperform, primarily due to valuation levels.
The stock was selling at 530, so for half my position I put a limit order in at 531 or so, trying to get cute and pick up an extra buck. My order didn’t go off went off because it never hit 531, and dropped into the 520’s. So the next day the stock opened at 520, and because at this point I was frustrated and had a use for the money in other stocks, I put a sell order in at 521 and it sold.
I still had the other half of my holdings, so I still was watching the stock. Of course in the next week the stock hit 540, and now I was really mad at myself for trading irrationally – why didn’t I wait? Then on Wednesday I saw the stock getting hammered, dropping down to 515, but I didn’t see any news and I didn’t have time to research it. This morning when I checked it it was at 505 – and because I still had half my orignal holding, I did a little research and found this article at fool.com. Essentially there are rumored to be an increasing number of lawsuits against surgeons who have botched things with the machine, and other negative news.

I had to make a decision – is this just a stock manipulation (very possible), or is this smoke where there may be fire? I did something I rarely do – I when ahead and fired off a market order the current price ($504 – ouch!). Why? First of all I did a market order because I didn’t want to try to squeeze a dollar or two out of the stock when there was such potential risk. The other reason for selling was Puget Investor convinced me that the upside potential wasn’t that great, and I am staring a possible disaster in the face.
ISRG ended the day at 488 – who knows where it will go from here.
What did I learn from this?
I feel good that I was proactive in identifying that I really shouldn’t own this stock before all this started happening. I know nothing of the medical industry, and to own a stock of this valuation you really have to believe in it. Ideally I should of sold it all at $540, but when you dont believe in a stock anymore, its probably time to get out rather than trying out how to find the top. Even if this news isn’t true, there will likely be enough lingering rumors that the stock wont be outperforming the market anytime soon, so if I change my mind I could get back in.
I also am questioning the wisdom of limit orders – maybe they fall in the pennywise pound foolish category. I am re-evaluating my use of limit orders, and if I want to make a move don’t try to game the market.
Medium to long term ISRG could very well jump higher from here and I will be proven wrong (at which point maybe I will delete this post…), but I think I will be comfortable with my actions regardless of what the future holds.
Of all the stuff I have been reading in order to try to get a feel for my 2013 prediction, these 2 charts kind of sum it up:
Historical Debt to GDP

So this chart provided in an article by Bond Fund guru Bill Gross ) says anytime the deb to GDP ratio gets above 90%, growth slows, and inflation increases. Debt to GDP in the us is now above 90%, so assuming this whole fiscal cliff situation gets resolved, and results in tax increases and or spending reductions which reduce the deficit, one would have to assume this austerity would have a negative effect on growth. I am still skeptical that inflation will increase – I go back to my Japan Economics post to believe that inflation wont reignite.
Couple the above chart with this chart provided in the presentation by MaryMeeker :

Given the growth of consumer debt, especially student loan debt, how much longer can the consumer go before deleveraging must begin? If we assume the consumer wont be growing debt much more in the next few years, one would have to assume the consumer wont take up the slack if and when government deleverages.
So I am not looking for much earnings growth in 2013. I don’t think the stock market will have as good of year as 2012, however it wouldn’t surprise me if the market does better than bond yields. However this all changes if government continues to go into debt – at which point I would consider reducing exposure to bonds increasing exposure to inflation defensive assets such as gold, real estate and commodities.
So keep an eye on what goes on in the next few months – it should be an interesting year.
In recognition of the 25th anniversary of the 1987 stock market crash, this article caught my eye. For those to young to remember – the stock market lost over 20% in one day. However for the full year the Dow Jones ended positive. To me this article brought light to the big problem then – and now. Too few people making decisions with too much monetary power.
http://brucekrasting.com/how-i-caused-the-1987-crash/
We face the same problems today – if a small group of bankers of fund managers decide the markets going to turn, they get out at once – and the market gets hammered. I agree with many that the market is too liquid – and that we need to discuss some sort of trading tax to reduce market swings caused by excessive speculation:
Perhaps we need another market crash to raise awareness and build political will to reign in on this.