For the last few years I have been tracking my asset allocation on a spreadsheet, to ensure that I keep within the rules I set for myself of what to invest in. If I look back to the early days of my investing, I believe I have a tendency to overweight in stocks when the market is doing well, and underweight when the market is low. Most investors do succumb to this emotional tendency – buy high – sell low, and so I think every investor should use an asset allocation strategy to try to drive emotion out of investing.
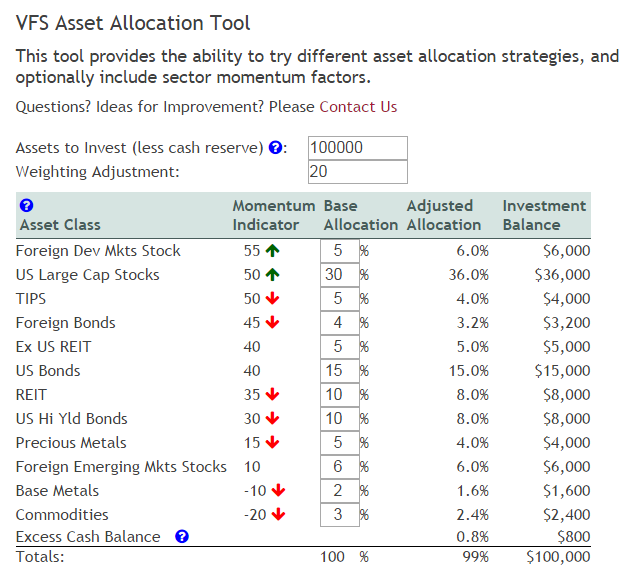
As part of my ongoing tinkering with JavaScript libraries, I decided to embark on the project to migrate my spreadsheet to a webpage, where anybody can use it to experiment with asset allocation. The resulting tool now appears on the vfsystems.net site at http://www.vfsystems.net/investing-tools/asset-allocation-tool/

Note that my sample allocations are spread across a wide variety of asset classes. This tool includes a lot more categories than the average investor would care about, but I thought it was good to include as many categories as possible to at least make investors think about what categories to consider. Note also I included the red and green arrows next to most asset classes. This isn’t too clearly explained in the page – but it ties back to some of my earlier work in asset allocation where I adopted a strategy of over-weighing categories based on momentum. To recap – historically if you overweight / underweight the S&P 500 based on a 10 month moving average, history tells you it will increase your return. So I have expanded this to include overweight / underweight indicators for the other asset classes where history shows a return increase based on momentum. Note that some asset classes show no correlation to this strategy, and for those I did not factor those into the weighting adjustment. As a side note – for those categories I plan to someday look into what factors could also be included to see if a pattern can be determined – but thats on my ‘someday to-do list’ at this point.
On a technical note, this project was quite interesting. This was my most complex JavaScript library project to date. Other than an API call to Puget Investor to get the initial asset classes and weightings, this application runs client side, using AngularJS and JQuery. So even though it runs in WordPress on PHP, there was no PHP coding other than adding the scripts for Angular and JQuery/JQuery UI. The Angular JS part of it was pretty smooth – interestingly it was the Jquery UI stuff that gave me the biggest headaches. I use JQuery UI to build the help dialogs over the question mark icons – and I formulated a standard pattern that I plan to incorporate in future projects for these help boxes. But getting the dialogs to position and resize correctly took me much longer than I had anticipated, largely due to changes in JQuery between versions 1.9 and 1.10. One of the hazards in using the internet for all your research is you find examples for many different library versions, and its hard to find the right example for the version you are using.
The other framework decision I made with this tool was to host this at vfsystems.net. Rather than have these tools on Puget Investor, I plan to have VFSystems be the home for my investing tools, and focus Puget Investor back to a stock portfolio tracking tool. I think vfsystems.net makes for a better jumping off point for my various investment related endeavors, so look for more tools to appear at vfsystems.net.
I encourage anybody with an interest to try out this new tool – it may help you refine your investment strategy, and perhaps give you new ideas about investing alternatives. And please – any ideas for improvement or feedback – please leave a comment below, or send a note to Vertical Financial Systems.


