VIRTUAL DAN

VIRTUAL DAN

Notes from my travels around the internet

VIRTUAL DAN
  • My Pacific Northwest Solar
  • About
Monthly Archives: March 2018

RSI And Market Movements

Over the holidays I was talking investments with family members, and the question came up as to whether I thought the RSI Indicator was of any use or not.  To be honest, I responded I had never looked at it, so I couldn’t offer an opinion.  Since then, I have been casually watching it, and I am now of the belief there may be something to it.

In case you are not familiar with the Relative Strength Index (RSI) technical indicator, it essentially tracks short term momentum.  This page provides a great overview of how it is calculated and its history.  In summary, it flashes a sell signal when a dramatic increase has happened over 14 days, or a buy signal when a dramatic decrease happens over 14 days.  The theory being that after 14 days of buying or selling, the inventory of people who would buy or sell is pretty much exhausted.

So in late January, I noticed a bunch of stocks where the RSI was flashing sell.  In particular, the S&P ETF (SPY):
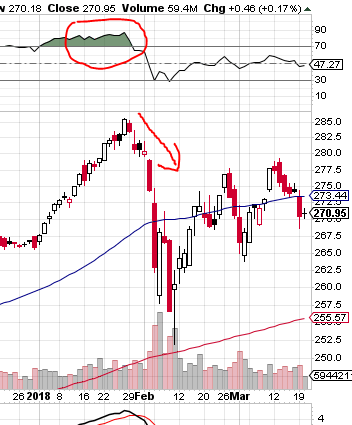
S&P 500 (SPY)

Notice after the big run-up the RSI was over 70 (SELL!)  and subsequently the market corrected.  It then switched to a buy (RSI under 30) at the bottom.  Note however that it kept going up after initially hitting the over 70 mark, so if you sold then it likely wouldn’t have worked.

Amazon was the one that caught my eye.  This was my first test case, as I was looking to reduce my exposure to Amazon anyway, I figured with the RSI over 70, that was a reasonable time to unload some shares.
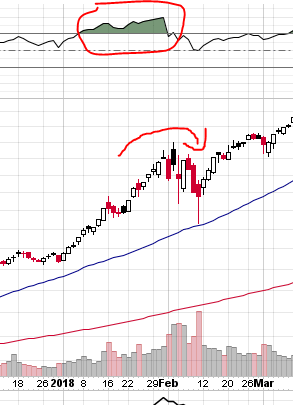
Amazon (AMZN)

This didn’t work real well, since it dropped less than most stocks in early February, and it quickly recovered the loss later in February.

The current one I am watching is Zillow:
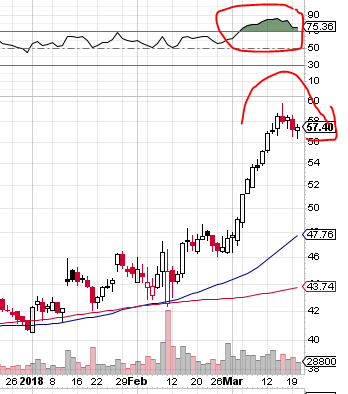
Zillow Group (ZG)

 Looks like it is following the classic pattern, and now the price is starting to break down.  My working theory is that the strategy is to underweight a stock that has been over 70 RSI for 4 days.  And consider overweighting a stock when it hits 30 RSI.  Of all the charts I have looked at, that appears to be the formula based on the patterns.

My next step is to start tracking RSI and backtest a number of different formulas to see if there is a pattern here.  And if there is, I will plug it into my stock technical model.

The above charts were provided by stockcharts.com.  Try running some of your favorite symbols thru there and see if you find a pattern.  I still am resisting technical analysis, it seems a little voodoo that this is all driven by emotion.  But if I can nail down a pattern with this indicator, I might finally give in to the dark side of investing.

March 20, 2018 Dan Leave a comment

Data Visualization

I was talking with a co-worker recently about data visualization, and he showed me a site he ran across with the latest and greatest in Graphing.  D3 (Data Driven Documents) has some pretty amazing ways to chart data – check out the gallery of examples here.

In playing around with these charts, this looks to be quite a step up from Google Visualization charts.  The JavaScript coding to load the charts looks pretty similar to Googles approach, so it should be pretty easy to migrate to this new D3 library.

One drawback to both D3 and Google Visualization charts is that they are JavaScript based, so they only run in a browser.  I am still looking for a decent solution for emailing charts.  While there are a few paid libraries that will render images, I still haven’t a library to replace the Google Image Charts that Google officially deprecated in 2012.  Google Image charts still work, but Google may pull the plug on those at any time.  One final note regarding emailing charts – to date I have been able to skirt the issue, because when I want to send an email with a chart – the better approach is to send an email telling the recipient to log in and view the data on their website.  This has the advantage of driving traffic to your website, and easily capturing info as to if your recipient actually viewed the chart.  So maybe it is just a bad practice to embed full data visualizations in emails.

With all the expansion of data we have seen over the last few years, its nice to see display technologies keeping up.  Now the hard part is in trying to figure out which kind of chart to use when displaying data – perhaps we have too many options.

March 6, 2018 Dan Leave a comment

Archives

  • February 2021 (1)
  • January 2021 (1)
  • December 2020 (2)
  • November 2020 (2)
  • October 2020 (2)
  • September 2020 (2)
  • August 2020 (2)
  • July 2020 (2)
  • June 2020 (2)
  • May 2020 (2)
  • April 2020 (2)
  • March 2020 (2)
  • February 2020 (2)
  • January 2020 (3)
  • December 2019 (2)
  • November 2019 (2)
  • October 2019 (2)
  • September 2019 (1)
  • August 2019 (2)
  • July 2019 (2)
  • June 2019 (1)
  • May 2019 (3)
  • April 2019 (2)
  • March 2019 (2)
  • February 2019 (2)
  • January 2019 (3)
  • December 2018 (2)
  • November 2018 (2)
  • October 2018 (2)
  • September 2018 (2)
  • August 2018 (2)
  • July 2018 (2)
  • June 2018 (2)
  • May 2018 (2)
  • April 2018 (2)
  • March 2018 (2)
  • February 2018 (1)
  • January 2018 (3)
  • December 2017 (2)
  • November 2017 (2)
  • October 2017 (2)
  • September 2017 (2)
  • August 2017 (2)
  • July 2017 (2)
  • June 2017 (3)
  • May 2017 (2)
  • April 2017 (1)
  • March 2017 (3)
  • February 2017 (3)
  • January 2017 (2)
  • December 2016 (2)
  • November 2016 (3)
  • October 2016 (2)
  • September 2016 (2)
  • August 2016 (2)
  • July 2016 (2)
  • June 2016 (2)
  • May 2016 (2)
  • April 2016 (2)
  • March 2016 (2)
  • February 2016 (3)
  • January 2016 (4)
  • December 2015 (2)
  • November 2015 (2)
  • October 2015 (3)
  • September 2015 (3)
  • August 2015 (2)
  • July 2015 (4)
  • June 2015 (2)
  • May 2015 (4)
  • April 2015 (3)
  • March 2015 (4)
  • February 2015 (4)
  • January 2015 (4)
  • December 2014 (5)
  • November 2014 (3)
  • October 2014 (5)
  • September 2014 (3)
  • August 2014 (5)
  • July 2014 (4)
  • June 2014 (4)
  • May 2014 (3)
  • April 2014 (3)
  • March 2014 (5)
  • February 2014 (2)
  • January 2014 (5)
  • December 2013 (4)
  • November 2013 (6)
  • October 2013 (3)
  • September 2013 (3)
  • August 2013 (4)
  • July 2013 (3)
  • June 2013 (3)
  • May 2013 (5)
  • April 2013 (2)
  • March 2013 (6)
  • February 2013 (6)
  • January 2013 (5)
  • December 2012 (5)
  • November 2012 (4)
  • October 2012 (3)
  • September 2012 (4)
  • August 2012 (3)
  • July 2012 (3)
  • June 2012 (2)
  • May 2012 (3)
  • March 2012 (3)
  • February 2012 (2)
  • January 2012 (1)
  • December 2011 (3)
  • November 2011 (3)
  • October 2011 (2)
  • September 2011 (2)
  • August 2011 (3)
  • July 2011 (4)
  • June 2011 (4)
  • May 2011 (3)
  • April 2011 (6)
  • March 2011 (8)
WEBSITE DISCLAIMER: The operator of this site (Vertical Financial Systems, Inc) are not registered investment advisers, broker/dealers, or research analysts/organizations. The content on this website is issued solely for information purposes and should not to be construed as an offer to buy, sell, or trade in any way, any security mentioned herein. All information presented on this website is believed to be reliable and written in good faith, but no representation or warranty, expressed or implied is made as to their accuracy, completeness or correctness. You are responsible for doing your own research before investing in any securities mentioned herein. Readers are urged to consult with their own independent financial advisors with respect to any investment. Neither Vertical Financial Systems, Inc, nor its officers or employees accept any liability whatsoever for any direct or consequential loss arising from any use of information on this website.
Full Disclosure: As an Amazon Associate I earn from qualifying purchases
Powered by WordPress | theme SG Simple