Every month the financial press makes a big deal about the total payroll report. I have never really paid attention to it, as it seems like its just headline material rather than anything one can act on financially. Recently, I was poking thru the FRED data sets looking for an employment indicator that I could plug into my valuation model, and the one that caught my eye was a subset of the big monthly number – the Temporary Help Services number.
I put together this chart below comparing the numbers of the Wilshire 5000 stock market index, the Temporary services number, and the headline Nonfarm Payrolls number.
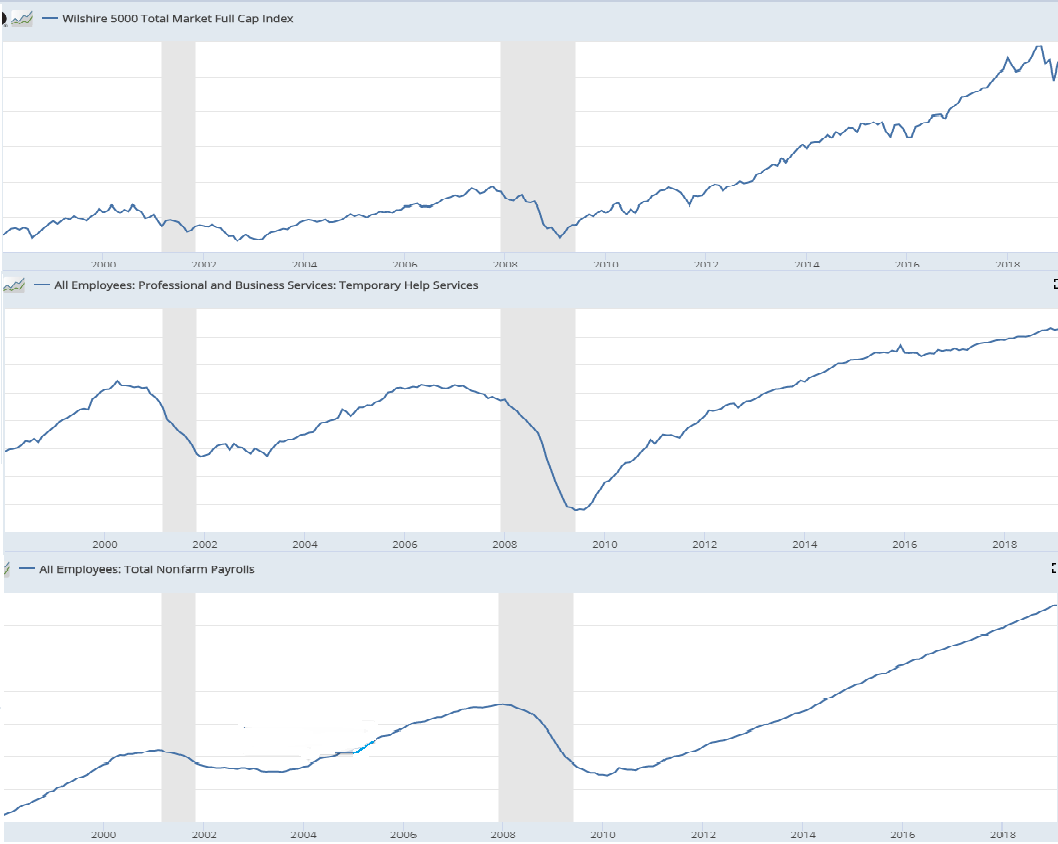
As far as an early indicator of economic downturn (and hence a stock market downturn), it seems like the temporary help number is a much better indicator. The temporary help number started trending downward months before the non-farm payroll number, and even started rising sooner after the 2001 and 2008 recessions. There are some ‘headfakes’ in the temporary help number, but with a little smoothing I think my stock market model can be taught to ignore those.
One thing I have learned over the last several years while looking for correlations is there are a lot of coincidental correlations. So when I add data factors to my model, I give the data a good old fashioned smell test – does this data seem reasonable? In this case, I have rationalized that yes, it seems reasonable that in an economic downturn, companies would start jettisoning temporary employees early as they start to slow down, since those are typically the easiest and cheapest employees to part ways with.
So now when the monthly noise comes out about the jobs number, I will continue to ignore that number – but that will trigger me to look deeper at the temporary help number that gets released at the same time.